

SQL Visualizer Online: Visualize Queries, Joins, ER Diagrams & Lineage
A SQL visualizer converts SQL queries into diagrams — either showing what a single query does, step by step, or mapping how data flows across tables, joins, and columns. Below you can try both, free and in your browser.
🔍 Understand what one query does
Paste a SELECT and get an interactive logic-flow diagram — sources → joins → filters → aggregates → window functions, in true execution order. Click any node to jump to the matching SQL. No signup, runs in your browser.
🔗 Map data lineage & ER diagrams
Trace column-level data lineage across queries, views, and stored procedures — plus auto-generated ER diagrams — over 20+ SQL dialects. Built for documenting and auditing whole pipelines.
What Is a SQL Visualizer?
A SQL visualizer, also known as a database visualization tool or SQL query visualizer, is a software application that helps developers, data engineers, and analysts interact with and understand SQL queries visually. Instead of reading raw SQL text, you see how tables connect, where data flows, and how joins link columns across schemas.
SQL visualizers that support data lineage analysis represent how data flows from source to destination within a database system. This is especially useful for understanding dependencies and relationships between tables and columns in complex queries.
Two Ways to Visualize SQL: Intent and Lineage
“Visualizing SQL” actually covers two different jobs, and the right tool depends on which one you’re doing:
- Understand a single query’s logic — what does this 200-line SELECT actually do? You want to see the order operations run in, how CTEs feed each other, and what each window function computes. The SQL Intent Visualizer is built for this.
- Map data flow across many queries — where does this column come from, and what breaks if I change it? You want column-level lineage and ER diagrams across views, stored procedures, and whole pipelines. SQLFlow is built for this.
Both turn SQL into diagrams. One explains meaning; the other maps movement.
Visualize Query Intent with the SQL Intent Visualizer
Ever opened a 200-line SQL query and had no idea what it actually does? The SQL Intent Visualizer turns any SELECT into an interactive logic-flow diagram. It shows how data moves from your source tables through joins, filters, aggregations, and window functions to the final result — in the order SQL really executes, rather than the order it’s written. Click any node to jump straight to the matching SQL, expand CTEs and subqueries inline, and get plain-English, step-by-step explainers for tricky window functions like ROW_NUMBER, RANK, and SUM OVER.
- Logic-flow graph of every SELECT: sources → joins → filters → aggregates → windows → output, in true execution order.
- Click-to-trace — select a node and the exact SQL fragment highlights, and back again.
- CTEs & subqueries expand inline so you can drill into multi-stage pipelines.
- Window-function explainer — a step-by-step lane visualization for ROW_NUMBER, RANK, DENSE_RANK, LAG/LEAD, and running SUM/AVG/COUNT.
- Multi-dialect, powered by the same General SQL Parser engine behind dpriver’s other tools.
Paste your query, pick your dialect, and read the intent behind the SQL in seconds — no signup, runs in your browser.
Try the SQL Intent Visualizer →
SQL Query to Diagram Example
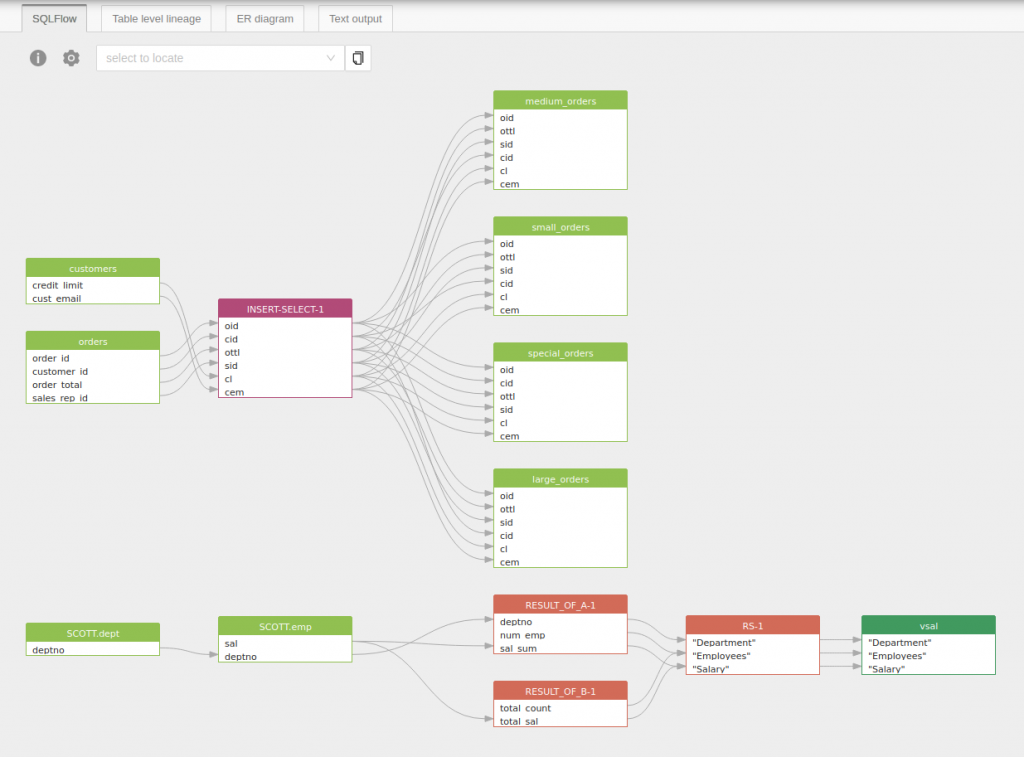
Below is a real example. The SQL joins two tables — orders and customers — and selects several columns from each.
SELECT o.order_id oid, o.customer_id cid, o.order_total ottl,
o.sales_rep_id sid, c.credit_limit cl, c.cust_email cem
FROM orders o, customers c
WHERE o.customer_id = c.customer_id;
The SQL visualizer parses the query and generates the data lineage diagram below, showing column-level relationships between orders and customers:
Visualize this SQL in SQLFlow →
What Can a SQL Visualizer Show?
- Tables — which tables a query reads from or writes to
- Joins — how tables are linked through
JOIN, implicit join conditions, or subqueries - Columns — which columns are selected, filtered, or transformed
- Data lineage — how data flows from source columns through transformations to output columns
- ER diagrams — entity-relationship structure inferred directly from SQL schema or queries
- ETL flow — the full extract-transform-load path across stored procedures or multi-step pipelines
Using a SQL Visualizer to Generate ER Diagrams
SQL visualizers can generate Entity-Relationship (ER) diagrams by analyzing the underlying database schema or SQL DDL statements. The tool identifies entities (tables), attributes (columns), and relationships (foreign keys, join conditions) and represents them graphically.
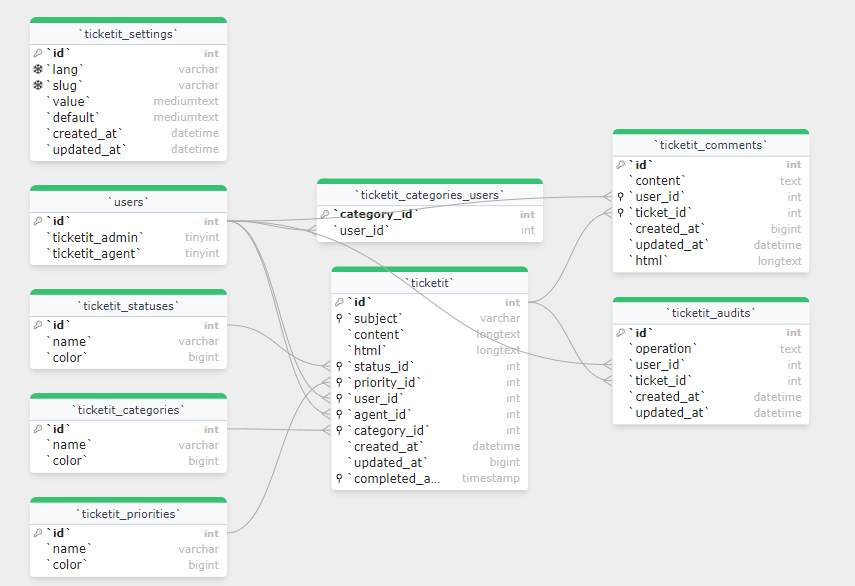
Metadata about tables and columns — data types, constraints, and primary/foreign key relationships — is displayed alongside the visual representation. Users can filter the visualization by data type or specific columns to focus on the parts of a schema that matter.
SQL Visualizer vs SQL Formatter vs SQL Parser
| Tool | What it does | Output |
|---|---|---|
| SQL Formatter | Reformats SQL for readability — indentation, casing, line breaks | Formatted SQL text |
| SQL Parser | Breaks SQL into a structured syntax tree for analysis or transformation | AST / parse tree |
| SQL Intent Visualizer | Shows what a single query does — execution-order logic flow through joins, filters, aggregates, and window functions | Interactive logic-flow diagram |
| SQL Visualizer (SQLFlow) | Maps data flow across queries — column-level lineage and ER diagrams over whole pipelines | Lineage graph / ER diagram |
Need column-level data lineage across hundreds of SQL files? See SQLFlow for enterprise SQL lineage →
When Data Teams Use SQL Visualization
- Review complex SQL — understand a long query faster by seeing the logic flow instead of tracing every clause manually
- Understand inherited queries — onboard faster when taking over a codebase or ETL pipeline
- Document ETL logic — generate diagrams from existing SQL for documentation and compliance
- Analyze impact before schema changes — see which columns and downstream queries a change will affect
- Validate AI-generated SQL — visually confirm that LLM-generated SQL connects the right tables and columns before running it in production
Try SQL Visualization Now
Gudu SQLFlow is a SQL visualizer that supports column-level data lineage across over 20 SQL dialects, including Oracle, SQL Server, MySQL, PostgreSQL, Snowflake, BigQuery, Redshift, and more. It parses SQL queries, stored procedures, and DDL statements and generates interactive lineage graphs and ER diagrams.
To understand what a single query does, the SQL Intent Visualizer turns it into a logic-flow diagram in seconds — free and in your browser. Pick the tool that matches what you need to see:
Talk to us about SQL visualization for your team →
All lineage and ER diagrams in this post were generated by Gudu SQLFlow.
FAQ
What is a SQL visualizer?
A SQL visualizer converts SQL queries into diagrams that show tables, joins, columns, and data lineage relationships. It helps developers and data teams understand complex queries visually instead of reading raw SQL text.
What’s the difference between the SQL Intent Visualizer and SQLFlow?
The SQL Intent Visualizer explains what a single query does — it turns one SELECT into a logic-flow diagram showing execution order, joins, filters, aggregations, and window functions. SQLFlow maps how data flows across many queries, views, and stored procedures, producing column-level data lineage and ER diagrams for entire pipelines. Use the Intent Visualizer to understand a query; use SQLFlow to trace lineage across a system.
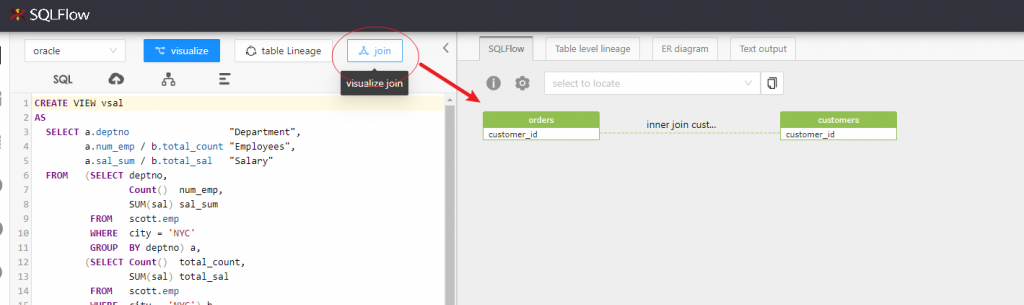
Can I visualize joins in SQL?
Yes. A SQL visualizer parses JOIN conditions — including INNER JOIN, LEFT JOIN, RIGHT JOIN, and implicit comma joins — and displays the table relationships and column mappings as a graph.
Can a SQL visualizer show data lineage?
Yes. A SQL visualizer can trace how columns flow from source tables through transformations and joins to output columns, giving you column-level data lineage from a single query or across an entire SQL pipeline.
Does it support stored procedures?
Advanced SQL visualizers like SQLFlow support stored procedures, views, and multi-statement ETL scripts across major SQL dialects including Oracle PL/SQL, SQL Server T-SQL, MySQL, and PostgreSQL.
Is my SQL uploaded or stored?
The SQL Intent Visualizer runs entirely in your browser — your SQL never leaves your machine. The SQLFlow online demo sends SQL to the server to generate diagrams; demo SQL is not retained or used for training. For enterprise use cases where SQL must stay on your infrastructure, Gudu offers on-premise deployment.